Make a Simple Webmap
How to make a simple, sharable webmap with Mapbox EditorWhat do you need?
- Mapbox account - Just go for the free Starter plan
- Sample data (Right-click>Save As)
Introduction
In a different tutorial we looked at how we could use Google Earth Pro to quickly make a custom, high-quality print map. While Google Earth is a fabulous tool, it has its limitations. First, you’re limited in your basemap options. You’re pretty much stuck with aerial imagery. While cool, aerial imagery can also pack way more detail than you might need for your map. Second, while Google Earth allows you to create a print or PDF map, it’s not great for making webmaps. There are better tools out there for getting you map online including Google My Maps, CartoDB, and Mapbox Editor.
Goal
In this tutorial, you’ll use Mapbox Editor to import existing data, create your own data, and share an interactive webmap. When you’re done, you’ll be ready to go out into the world and create your own informative webmap!
What is Mapbox Editor?
Mapbox Editor is a free, browser-based (read: no downloads!) tool that allows you to make simple interactive maps. With Mapbox Editor you have access to a variety of basemaps as well as the ability to both upload existing data and to draw points, lines, and areas in your map project. In this tutorial we’ll learn about the features and interface of Mapbox Editor by doing, but if you’d feel more comfortable focusing in on this application, do check out Mapbox’s “Anatomy of the Mapbox Editor” first.
Getting Started
- Go to Mapbox.com and if you’re not already, sign in to your account.
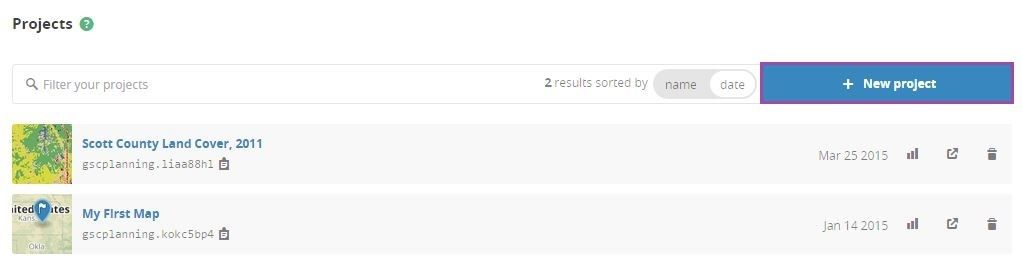
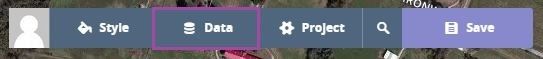
- Along the navigation bar across the top of your screen there are several options for you to click. Click the Projects icon (a little folder).

- You’ll be taken to your personal projects page. This where you will see all the projects you have created. Mapbox sets you up with one automatically called “My First Map.” However, we want to make a new map. Click the New Project button.
- Technically at this point you could hit Save and call it a day. You’ve already got a shareable map! But since we want to make our own unique map, we need to forge onward.
Selecting a Basemap
Before adding individual features to our map, it is a good idea to make sure we have a nice basemap for those features to sit on. Luckily, Editor offers several nice basemaps right out of the box.
- Navigate to the Editor toolbar and click Style. You should
see several basemap option show up, likely with
Streetsselected.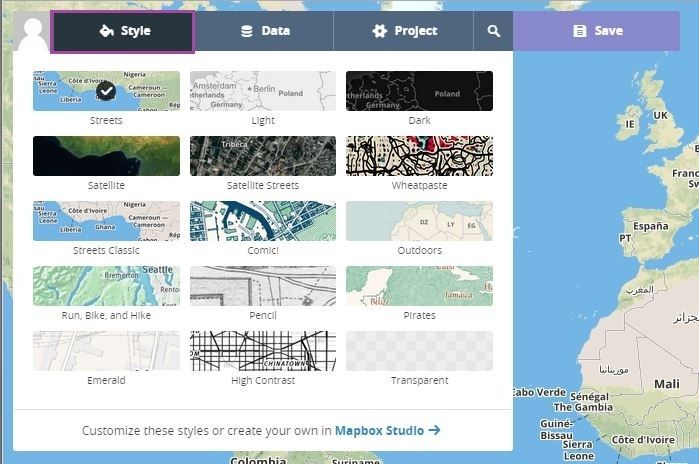
- Go ahead and click through and and check out the different basemaps. Zoom in on different places to see what the basemap styles look like at different scales. When you’re done exploring, select
Satellite Streets.
Adding and styling features
Now let’s add some features to our map. You can do this in a couple of ways:
- Import data into Editor
- Draw features in Editor
In this section we’ll do both and then add custom styling to our features.
Import & Style Data
Editor accepts a few common spatial data formats for import. These include:
- GeoJSON
- CSV
- KML
-
GPX
One common data type that is missing here is the Shapefile. You might consider using an online tool like Ogre or Shape Escape to convert your data into GeoJSON.
Let’s say we downloaded a parcel boundary from the Scott County PVA website and now want to use it in a our webmap. How would we bring it into Editor?
- If you haven’t already download the sample data for this tutorial. It’s just a single KML file containing a single parcel’s boundary line.
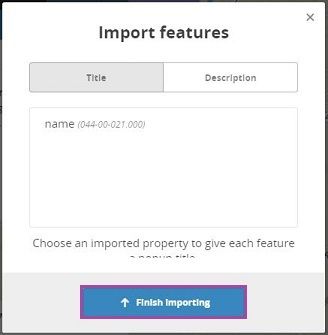
- You can import data through a simple drag & drop with your mouse. Open up the folder containing your data. Left-click on the icon for your data. While holding that click, drag your data anywhere into Editor. If your import worked, a new window titled Import features will popup.
- You have options for adding a title and description to your imported features. We’ll accept the defaults for now. Click Finish Importing.
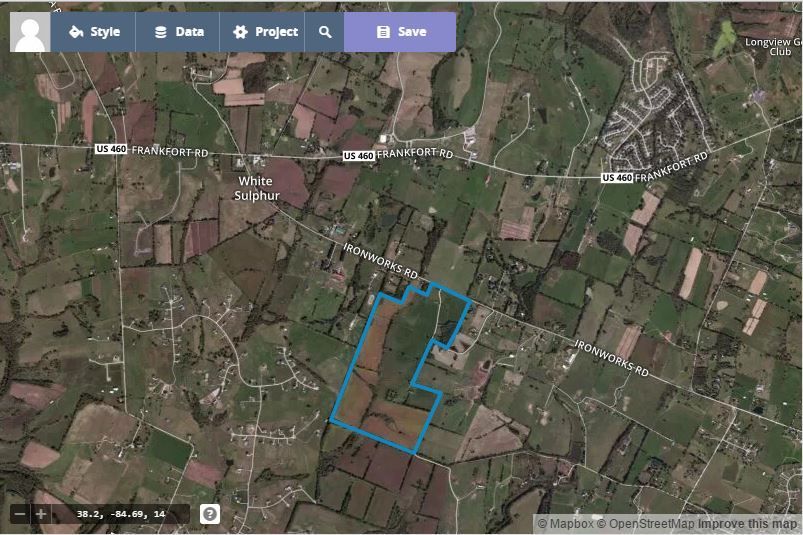
- The map should zoom to your imported data layer. Since in our case there’s only a single feature in that data, our map zooms to that individual parcel.
- The default blue line is nice, but can also imply water. Let’s customize the look of the parcel boundary. Click Data in the Editor toolbar and then click the menu button,
 . A dropdown window will appear listing the features you’ve added to the map. In this case you’ve only added one feature so only the parcel boundary is listed. Go ahead and click the listing for the parcel boundary
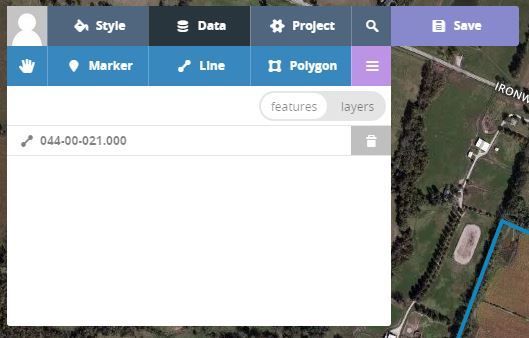
- You should now see a new window with two tabs,Text and Stroke. In the Text tab you can add a title and some descriptive text that the user will see when they click the feature. The Stroke tab is for adjusting the color, opacity, and width of the line. We’ll get to adding text a little later. Go ahead leave default text and click the Stroke tab.
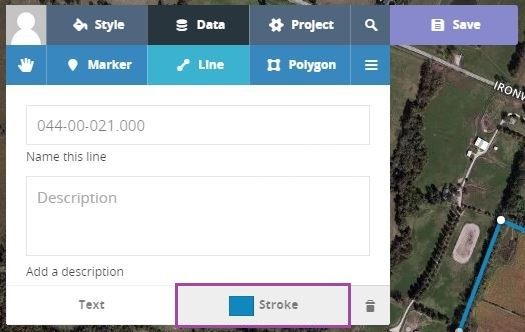
- The Stroke tab should now be open. Here you can adjust the opacity, width, and color of the line. Take a minute to mess around with the controls to see how changing them affects your map!
- You can use whatever settings you want, but for the tutorial we’ll be using the following:
Opacity: 1
Thickness: 6
Color: red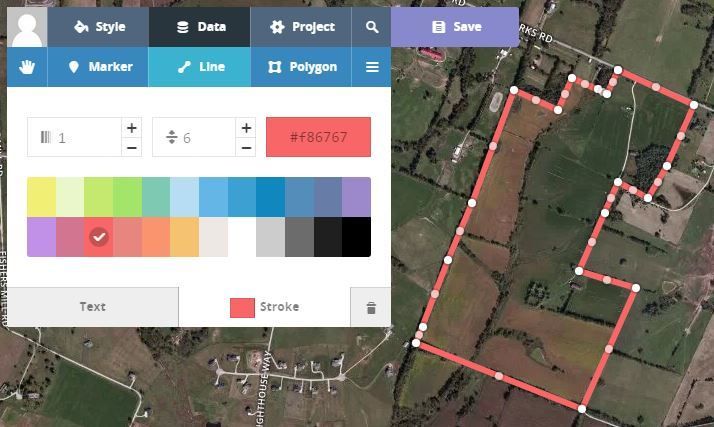
Now you have a custom styled line. Nice work! Let’s go on to add our own features directly into the map.
Create your own features!
Even if you don’t have pre-made data to import, Editor allows you to add markers, lines, and polygons to represent features you want to highlight. You can then add a title, description, and custom icon to more effectively communicate with your audience.
We want to highlight two different spots within our parcel. One is a small pond, the other a grove of trees. Let’s add a custom marker at each location!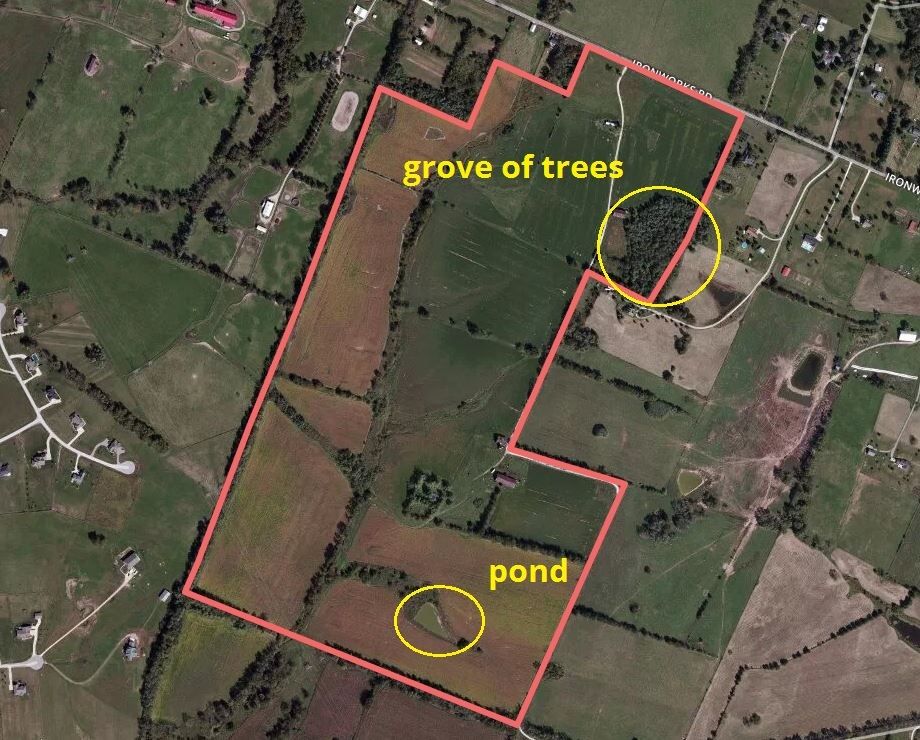
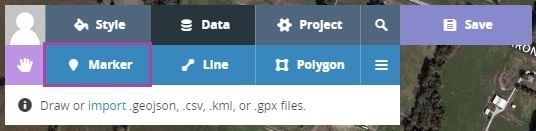
- First we’ll add a marker at the small pond. Navigate to the Editor toolbar and click Data
- With Editor you can draw three (3) different types of shapes: Markers, Lines, and Polygons. We’ll use a marker to point out the location of the pond. Click Marker.
- Your mouse pointer will turn into a set of cross-hairs.You may need to zoom and pan around to get the pond into view. Once you see the pond in your map, left-click where you want to place your marker. A teardrop-shaped marker should appear and a new window should drop down from the Editor toolbar.
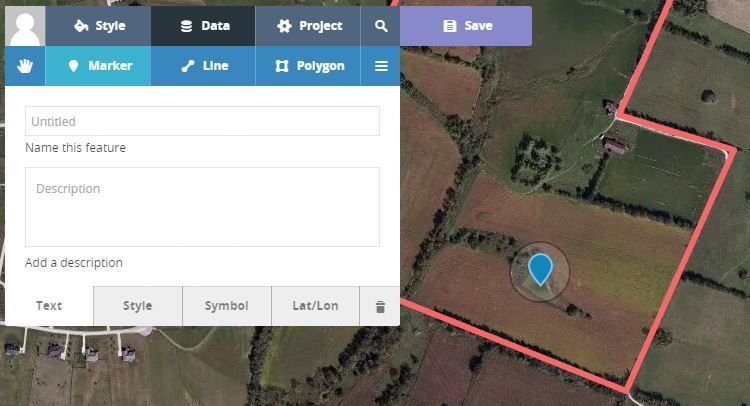
- The window that dropped down from the Editor toolbar is where you get to customize the what users will see when they click the marker as well as the overall appearance of the marker. Along the bottom of the window are four (4) tabs where you will take care of the customization. They are Text (for the popup when users click), Style (color and size of the marker), Symbol (icons that can be placed within your marker), and Lat/Lon (coordinates of the marker in latitude/longitude). Go ahead and take a minute to click through the tabs to take a closer look at the the customization options.
- Make sure you have the Text tab open. Here we can add a title for our popup and include some content. Let’s add a short descriptive title first, something like “Peaceful pond.” You’ll notice as you type, the popup on your marker will appear so you can preview your changes in real-time.
- We can add some extra context in the Description box. Let’s describe our pond in a little more detail:
A beautiful pond stocked with bass, crappie, and catfish. Located on the back of the property, this pond is a perfect getaway right in the backyard!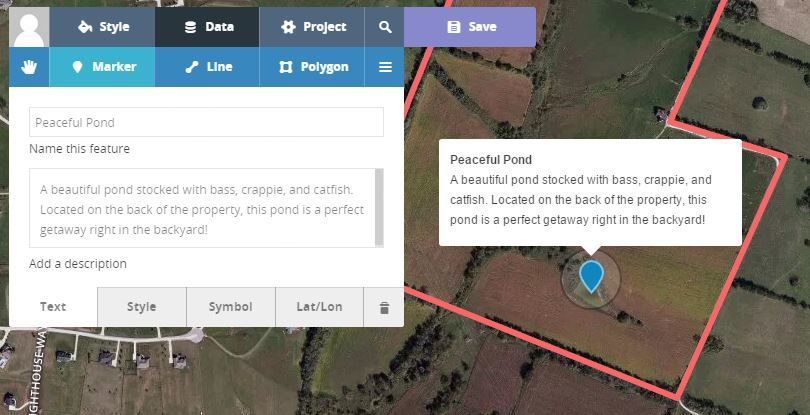
- We can even add a picture with a little html:
- Template for adding image:
<img src="path-to-image.jpg" /> - Example:
<img src="http://i1368.photobucket.com/albums/ag172/gscplanning/tutorials/simple-webmap-mapbox/swm24_zpsqlkq06nd.jpg" />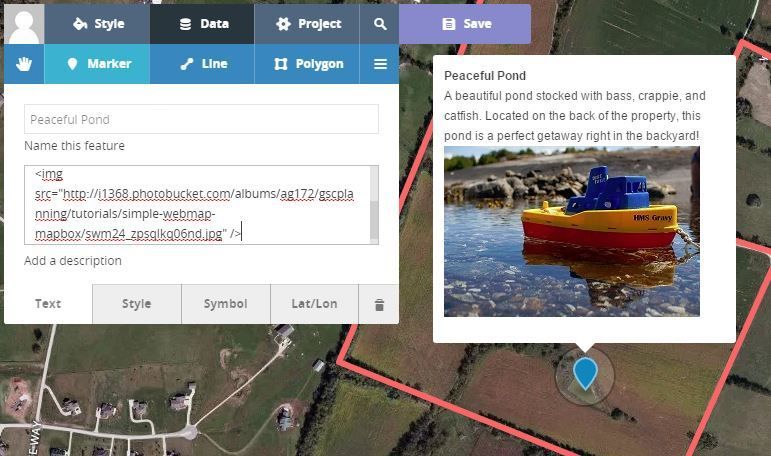
- Template for adding image:
- Now that we’ve got a nice, informative popup for our marker, let’s style the marker itself. Click the Style tab. Through this tab you can change the marker’s size
Let’s set our marker’s size to Large and color a lighter blue.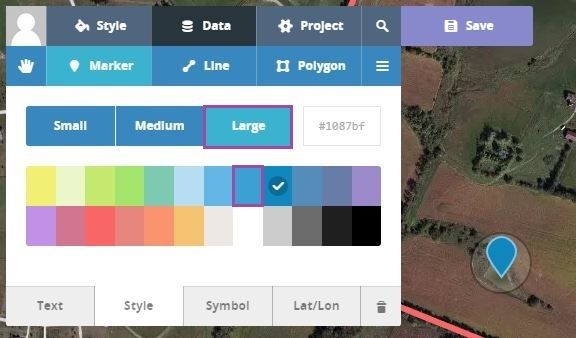
- Next, let’s add a symbol inside our marker. Click the Symbol tab. Here Mapbox provides you with a variety of symbols you can place inside your marker. Symbols are a nice way to give your user an additional visual clue about what they’re looking at! Go ahead and click through the library using the provided ↑ and ↓ buttons.
Let’s add the water droplet symbol to our marker.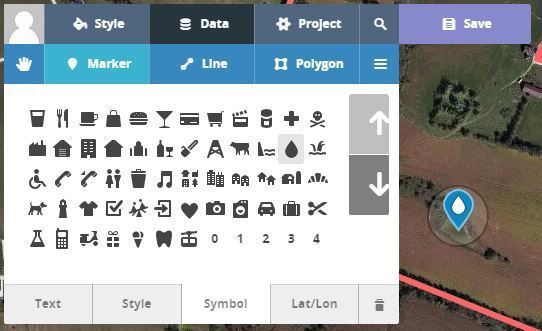 .
.
Congratulations! You’ve successfully added a marker to your map as well as gave it a custom popup and style. Now let’s add a different marker for the grove of trees at the front of the property. If you get stuck, refer to the steps above or the animation below for help.
At this point, you’ll want to save your project. Hit the Save button on the toolbar.

Final Touches
You’re almost ready to share your map. We just have a few more tweaks to make and it’ll be ready for the world.
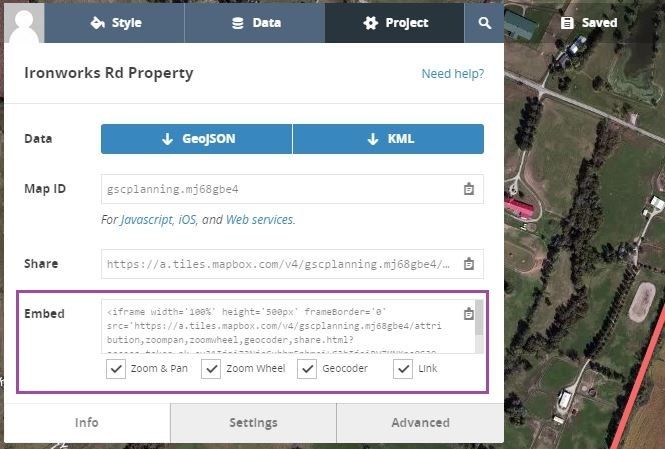
- Navigate to the Editor toolbar and click Project. This will open a dropdown with three tabs: Info, Settings, and Advanced.
- Click the Settings tab. Here you can give your map a title and a description:
Title: Ironworks Rd Property
Description: A map of features at the Ironworks Rd property.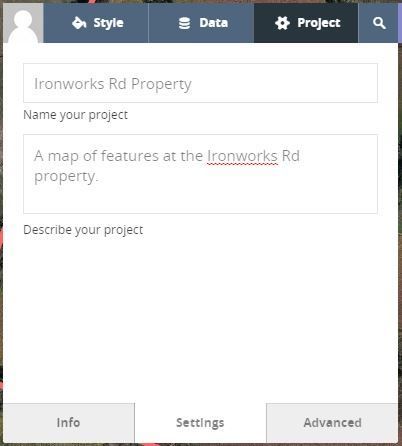
- Click the Advanced tab. Make sure your map is zoomed in to a level you like and your features are more or less centered within the map. Finally, if it isn’t already, check Save current map position.
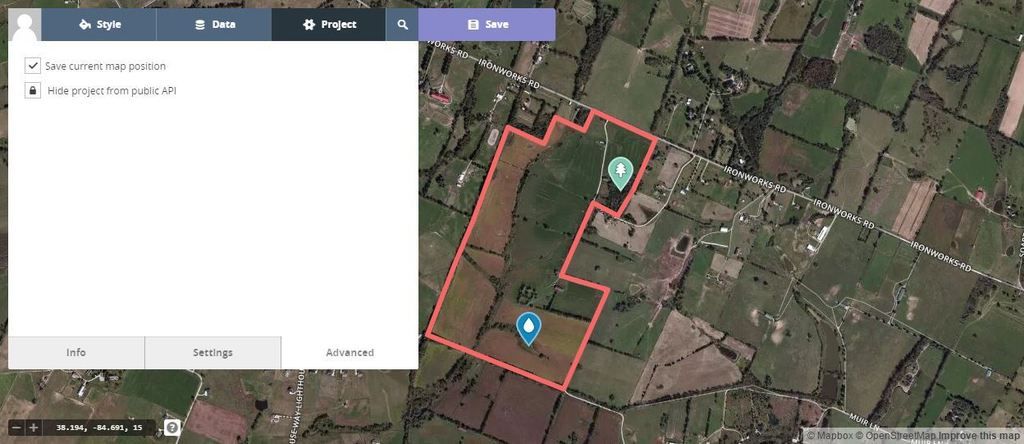
- Click Save.
Sharing your map
So far you have:
- Initiated a project in Mapbox Editor
- Selected a basemap
- Imported data
- Added and styled markers
- Given your map a title and description
- Established where and at what zoom level the map will be at when a user opens it.
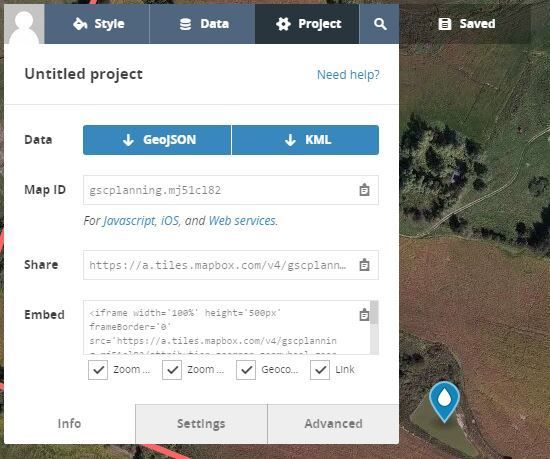
Now you’re ready to share. If you’re not there already, navigate to the Editor toolbar and click Project. Make sure you’re on the Info tab. We’ll walk through two ways you can share your map with the world.
Share directly
The simplest way to share your maps is its direct URL. To do this you copy the URL in the Share box.
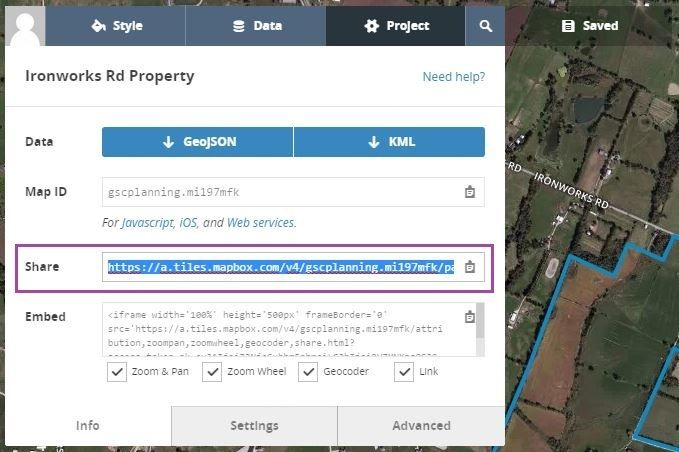
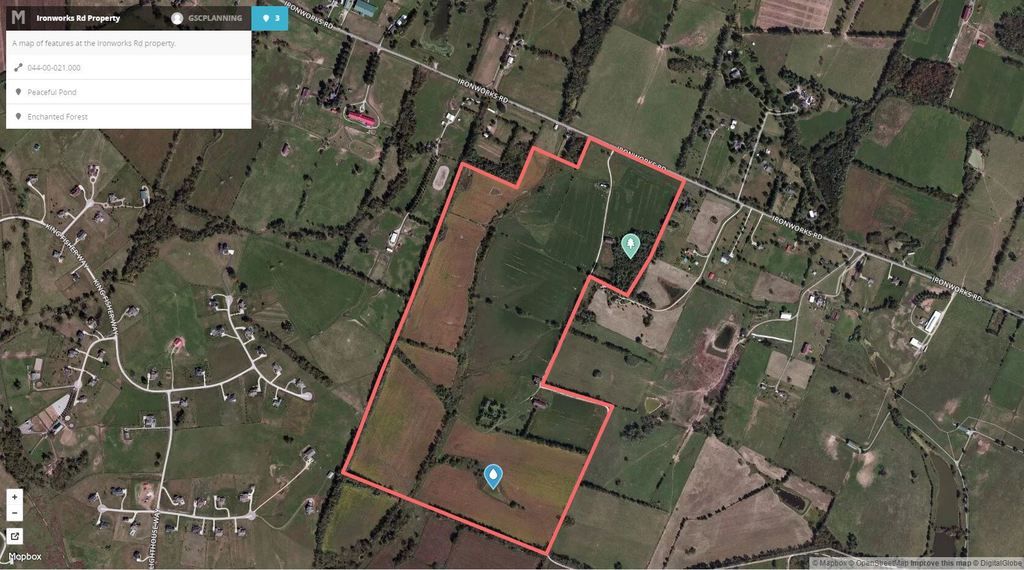
From here you can paste it in an email, on Facebook, or to create a link on your website. For now, open a new tab or window in your browser and paste the URL into the address bar. Press Enter. Now you can see the map your users will see!
Embed in a website
Another way to share your map to make it viewable on your website. Mapbox sets you up with some boilerplate iframe code that you can copy and paste directly in your website! Just copy what’s in the Embed box and paste it into the page you want the map to show up on.
Live example of a Mapbox map embeded in a website
See the Pen Mapbox Editor Embed Example by GSC Planning (@gscplanning) on CodePen.