From line to polygon
Some methods for converting those polygon-looking lines from the PVA into the polygons they should be!Introduction
You’ve downloaded a KML file of a parcels boundaries from the Scott County PVA. You’ve opened it up in Google Earth. Now you want to use that parcel either in a printed map or a web map. For many cases, you’ll be fine with the KML file as you downloaded. We’ve shown here that you can style and create a nice looking map with the data as-is. But let’s say you want to color in (or fill) the parcel. If you try to do that in Google Earth, you’ll find that you won’t be able to. Why? Because even though the parcel looks like an area, it’s actually formatted as a line. In effect, the parcel is just a line with the same start and end point and conceptually there is no “inside” and thus no area to fill. However all hope is not lost! In this tutorial we’ll walk through a couple of ways to turn that line into polygon that we can add some fill color.
What you’ll need
- A text editor
- If you don’t have a preferred text editor, Notepad (Windows) or Text Edit (Mac) will work just fine.
- A KML parcel boundary file (sample data)
Peaking under the Hood
For a given parcel boundary KML file, what does the data actually look like? Sure we’ve seen a visual representation, what does something like Google Earth read in order to turn that KML into an image? We can actually check this out!
<?xml version="1.0" encoding="UTF-8"?>
<kml xmlns="http://www.opengis.net/kml/2.2">
	<Document>
		<Folder>
			<name>QPublic Parcel</name>
			<Placemark>
				<name>044-00-021.000</name>
				<MultiGeometry>
					<LineString>
						<coordinates>-84.687180,38.198642,0 -84.683888,38.197461,0 -84.685064,38.195384,0 -84.685871,38.194309,0 -84.687184,38.194839,0 -84.687743,38.193811,0 -84.688857,38.191849,0 -84.686394,38.191266,0 -84.688708,38.187197,0 -84.695844,38.189434,0 -84.695553,38.189947,0 -84.694463,38.192229,0 -84.693451,38.194158,0 -84.691641,38.197945,0 -84.689744,38.197283,0 -84.689157,38.198375,0 -84.688009,38.197974,0 -84.687619,38.197832,0 -84.687180,38.198642,0</coordinates>
					</LineString>
				</MultiGeometry>
			</Placemark>
		</Folder>
	</Document>
</kml>
This may look a little scary, but never fear! See where the dual tags <LineString>...</LineString>? <LineString> is basically synonymous with line and when Google Earth sees that it knows that the values between the <coordinates>...</coordinates> tags should be read as a line.
Now let’s look at what’s between <coordinates>...</coordinates>. You should see a bunch of trios of comma-separated values. Those values represent the longitude, latitude, and altitude, respectively of each vertex in the parcel boundary. Notice that the first coordinate and last one are the same:
<coordinates>-84.687180,38.198642,0 ... -84.687180,38.198642,0</coordinates>'
That those two coordinates are the same means we’re well set up to quickly turn this line. This leads us to our first method.
Method 1: KML Surgery
In this method we will make a small alteration to a few tags in the KML file for the parcel that will ensure that it is read as a polygon rather than a line.
Steps
- Open up your preferred text editor.
- Navigate to File>Open. Find your parcel, single-click it, and click Open.
- Note: You may find when you navigate to the directory holding your KML file, it doesn’t show up. Sometimes programs will look for a default file format. There is a menu in your Open window that allows you to select which file type to filter for. Click that menu and select “All Files”
- Note: You may find when you navigate to the directory holding your KML file, it doesn’t show up. Sometimes programs will look for a default file format. There is a menu in your Open window that allows you to select which file type to filter for. Click that menu and select “All Files”
- Replace
<LineString>with<Polygon><outerBoundaryIs><LinearRing>as well as</LineString>with</LinearRing></outerBoundaryIs></Polygon>
- Save. Your parcel boundary is now a polygon!
Method 2: Moving on to GeoJSON
In this method we will both turn our parcel boundary into polygon and convert to GeoJSON. You might want to use this method if you’re going to make a webmap or want to add additional attribute information. We’ll use a cool browser-based application called geojson.io.
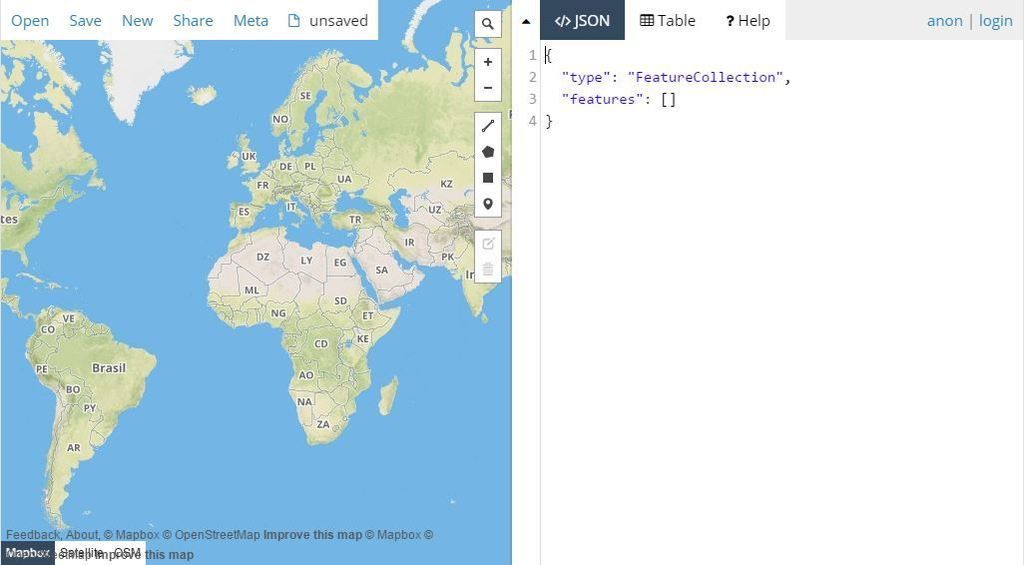
- In your browser navigate to geojson.io. You should be presented with two-column interface with a map on the left and editor on the right.
- Navigate to Open>File. Click.
- The Open window opens up. Navigate to the directory where your parcel file is located, single-click the file, and click Open.
- Your parcel will be show in the left map pane. When you loaded your KML file, it was converted into GeoJSON. That’s the text you see in the right pane.
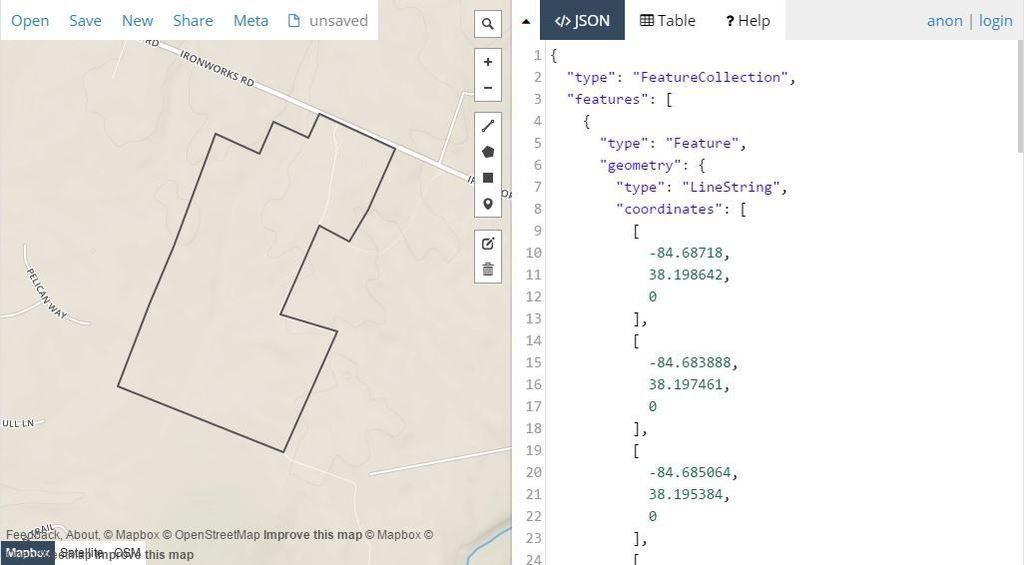
- Notice there is property
"type": "LineString". Change"LineString"to"Polygon".You may see some little red warning symbols pop up next to the line numbers. We’ll address that next.
- Add a
[after"coordinates":, but before the first[already there. Add a closing]before the closing}prior to"properties":...
- Your parcel is now a polygon! Navigate to Save and select the file format - GeoJSON, KML, or otherwise - you want to save your file as.